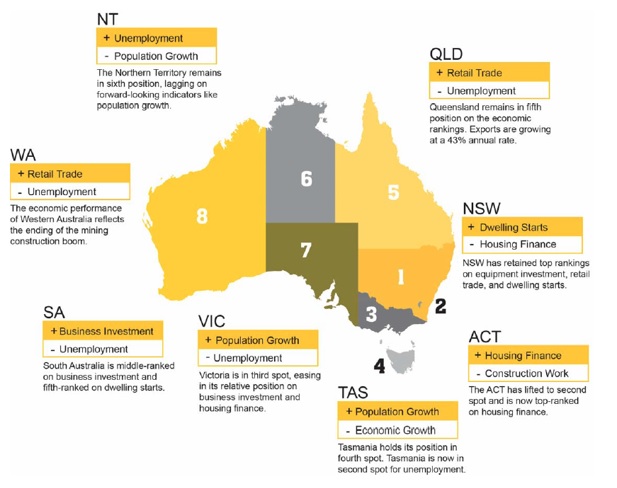
How are Australia’s states and territories performing? Each quarter CommSec attempts to find out by analysing eight key indicators: economic growth; retail spending; business investment; unemployment; construction work done; population growth; housing finance and dwelling commencements.
Just as the Reserve Bank uses long-term averages to determine the level of ‘normal’ interest rates; we have done the same with key economic indicators. For each state and territory, latest readings for the key indicators were compared with decade averages – that is, against the ‘normal’ performance. The State of the States report also includes a section comparing annual growth rates for the eight key indicators across the states and territories as well as Australia as a whole. This enables another point of comparison – in terms of economic momentum.
The latest data indicates a multi-speed national economy. NSW is solidly on top with little to separate ACT and Victoria. Then there is a gap to Tasmania, Queensland, Northern Territory and South Australia then another gap to Western Australia。
NSW has solidly held the position as the best performing economy, at or near the top on all indicators. The ACT has moved into second spot, improving its relative position on five of the eight indicators. Victoria has eased to third spot on the economic performance rankings but there is little to separate the state from the ACT. Tasmania remains in fourth spot just ahead of Queensland, Northern Territory and South Australia. The rankings haven’t changed in the last quarter. Western Australia continues to lag other economies and annual growth rates remain below national averages on all indicators.
ECONOMIC GROWTH
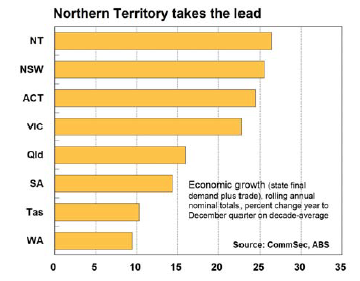 The Northern Territory has regained top spot on economic growth. Next strongest is NSW, with output 25.5 per cent higher than the decade average level of output. Then follows the ACT (up 24.4 per cent) from Victoria (22.7 per cent).
At the other end of the scale, economic activity in Western Australia in the December quarter was just 9.5 per cent above its decade average while Tasmanian activity was up 10.3 per cent, behind South Australia (up 14.4 per cent) and Queensland (up 16.0 per cent).
NSW has the fastest nominal annual economic growth rate in the nation, up by 7.5 per cent on a year ago, ahead of ACT (up 6.9 per cent), Victoria (up 4.8 per cent) and Queensland (up 3.5 per cent). The weakest nominal annual growth rates are in Western Australia (down 2.4 per cent) and South Australia (up 0.7 per cent).
RETAIL SPENDING
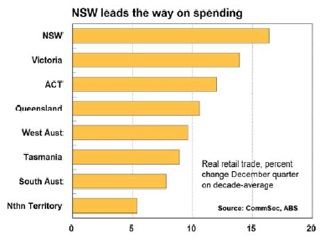 NSW has maintained the top spot on the retail rankings, followed by Victoria. In fact the only change in rankings compared with the September quarter was Queensland leaping head of Western Australia.
Spending in NSW was 16.4 per cent above decade-average levels in the December quarter. Solid activity in the housing sector, relatively low unemployment and higher home prices continue to support spending.
BUSINESS INVESTMENT
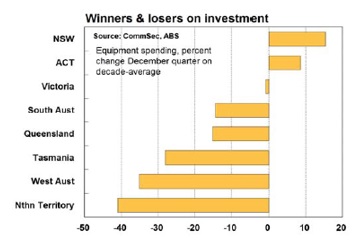 Only NSW and the ACT had business spending in the December quarter above decade-average levels: NSW (15.4 per cent) and ACT (8.6 per cent). However, equipment spending in Victoria was only 0.9 per cent lower than the decade average.
By contrast, other states and territories had business spending solidly below decade averages in the December quarter. Weakest was the Northern Territory (down 40.9 per cent).
EMPLOYMENT
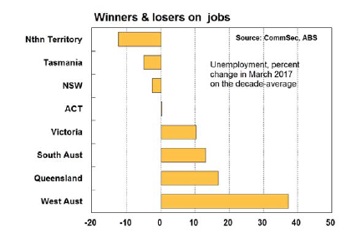 The lowest trend unemployment rate in Australia can be found in the Northern Territory at 3.5 per cent ahead of the ACT (3.7 per cent) and NSW (5.2 per cent).
Unemployment rates in Western Australia, Tasmania and Northern Territory eased over the past three months. Unemployment rates rose in other states but the jobless rate was stable in the ACT.
CONSTRUCTION WORK
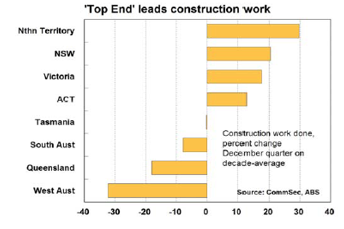 In terms of annual growth rates, ACT construction work done in the December quarter was up 27.5 per cent on a year ago, followed by NSW (up 8.3 per cent). Five economies had construction work lower than a year ago, led by Western Australia and the Northern Territory.
POPULATION GROWTH
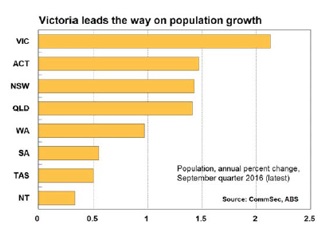 Population growth is clearly an important driver of the broader economy, especially retail spending and housing demand. Victoria continues to record the strongest annual population growth as well as holding first place on the differential with the decade-average rate.
NSW has the third highest annual growth rate in Australia at 1.43 per cent, behind the ACT with 1.47 per cent.
HOUSING FINANCE
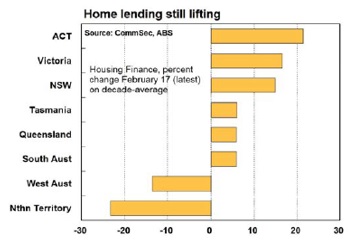 Housing finance is not just a leading indicator for real estate activity and housing construction but it is also a useful indicator of activity in the financial sector. In six of the states and territories – the ACT, NSW, Victoria, South Australia, Tasmania and Queensland – trend housing finance commitments are above decade averages. The ACT is now in top spot with the number of commitments up by 21.4 per cent on the long-term average. Next strongest was Victoria (up 16.6 per cent on decade averages) followed by NSW (up 14.9 per cent). Northern Territory remains the weakest for housing finance with trend commitments 23.3 per cent lower than its decade average.
DWELLING STARTS
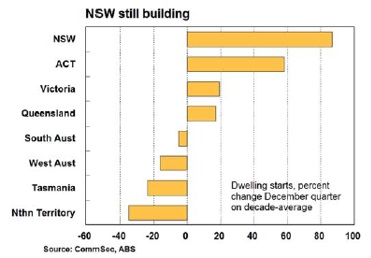 The outlook for home building is mixed across the nation. The NSW market remains strong, responding to rising population. And home building is also strong in the ACT and Queensland. By contrast, starts in Western Australia are at the lowest levels in more than four years.
NSW remains in top spot for dwelling starts with commencements almost 87 per cent above decade averages. The ACT is now in second spot behind NSW,followed by Victorian and Queensland.
“State of the States”, Commsec.com.au, 2017. [Online]. Available: https://www.commsec.com.au/stateofstates. [Accessed: 27- Apr- 2017].